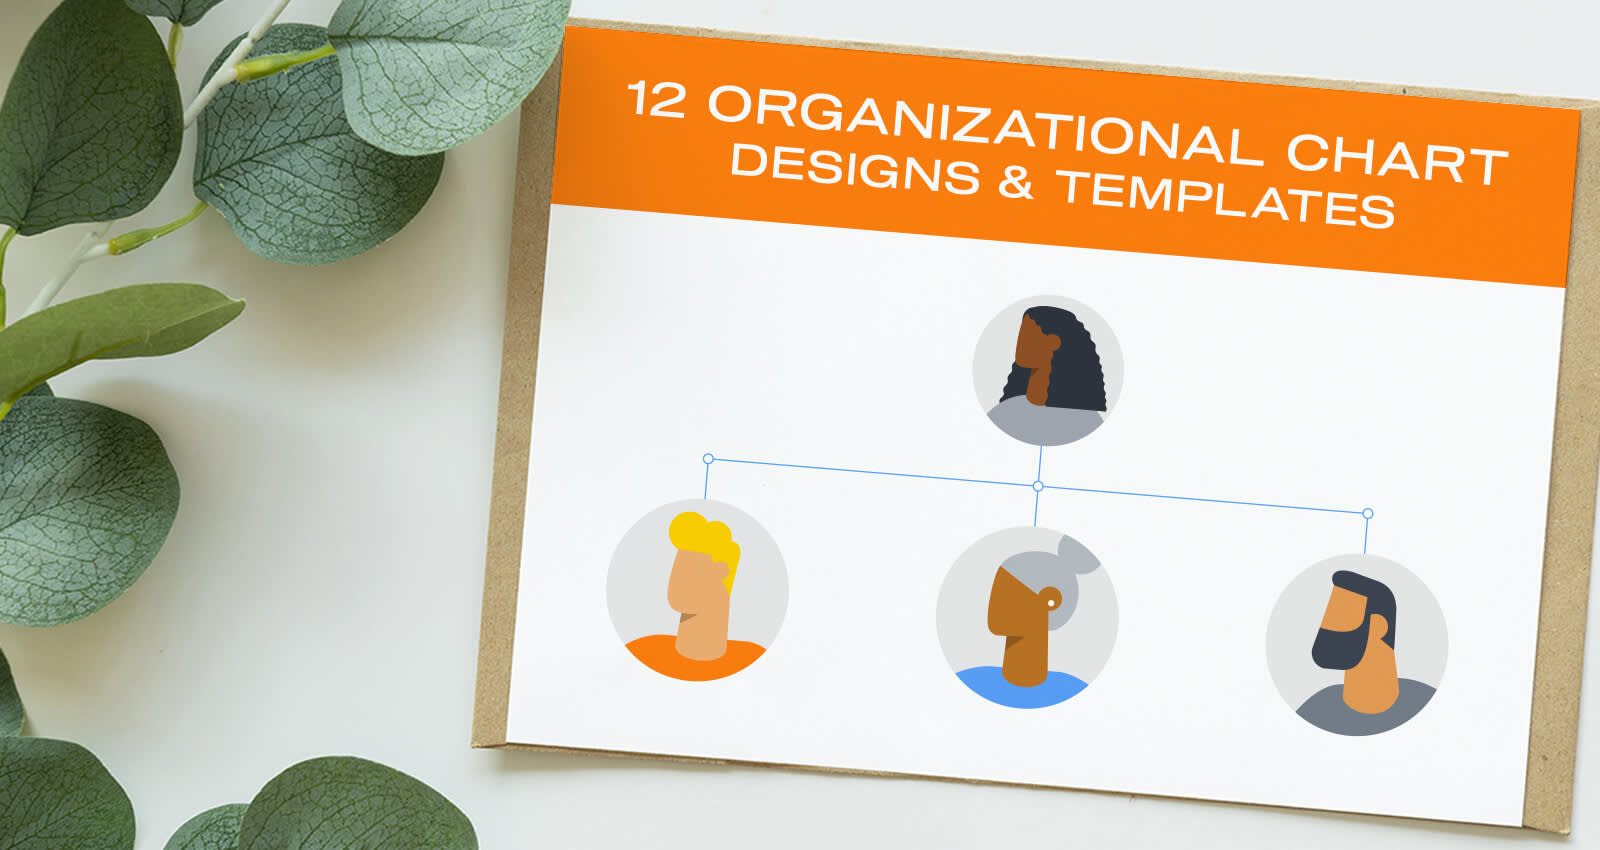
Chances are, you’ve seen an organizational chart that shows the hierarchy of a company from its C-suite executives to middle management all the way down to staff-level employees. Need to make one yourself? We’ve got you covered.
Let’s dive into the nitty-gritty of organizational charts, explore their benefits, and get inspired with these twelve creative organizational chart examples.
Benefits of organizational charts
Aside from being a strong visual, organizational charts serve many purposes for an organization and its external stakeholders, such as investors or board members.
Organizational charts visualize who commands the ship. By offering a hierarchical structure, stakeholders can easily glance at who is in command and the reporting relationships that stem from leadership.
Clear organizational charts empower new hires to understand the company’s structure. When onboarding with a new company, many new hires are learning the ins and outs of their organization. Becoming familiar with the organizational chart empowers new hires to know the company’s structure from top to bottom, while seeing how their role fits into the organizational puzzle.
Visual organizational charts help employees gauge how any changes may impact their role. Over time, organizations promote, hire, move, and fire employees. By having an organizational chart and updating it to reflect any changes, existing employees can understand how their roles may or may not be impacted over time.
Organizational charts echo and communicate the overall brand. In addition to showing the company’s hierarchy and reporting relationships, having an organizational chart leaves room to visualize a company’s mission and values.
12 organizational chart examples to inspire you
Not all organizational charts are designed equally. Different organizations may need different layouts in order to convey the structure of their organization. See what we mean with these 12 examples.
1. Minimal illustration organizational chart

Image via Shutterstock.
This vertically oriented organizational chart demonstrates a traditional top-down approach, with the CEO focused at the top and middle management and other staff below. Each level stems from the level above with different colors and icons differentiating each employee type, making this organizational chart example ideal for quickly visualizing a company’s structure.
2. Vibrant gradient organizational chart

Image via Shutterstock.
Prefer a more horizontally oriented organizational chart? This design focuses the leadership on the left side while middle management and staff extend towards the right.
This organizational chart design has a minimal approach that is simplistic yet impactful. The color gradient scheme creates focal points for leadership and middle management while staff tiles are outlined with a similar gradient look.
3. Simple icon organizational chart

Image via Shutterstock.
Rather than defaulting to circles or squares to display the hierarchical and reporting structure, try using icons to visualize your organization, with a short blurb explaining team members’ roles and responsibilities.
The beauty of using iconography to represent each hierarchy lies in the ability to go beyond mere shapes and colors and instead incorporate illustration and icon design into your organizational chart.
4. Bold manager organizational chart

Image via Shutterstock.
If you’re creating an organizational chart, chances are you will need to incorporate it into presentation slides or other marketing materials. This organizational chart example breaks down leadership and managerial roles into pleasing and easily digestible bullet points and boxes.
5. Square gradient organizational chart

Image via Shutterstock.
Gradients are a surefire way to incorporate brand colors in a visually appealing way, while keeping the overall design minimal. Vibrant gradients—when applied intentionally—can highlight focal areas, such as the C-suite executives, and easily guide viewers through the hierarchies.
Unleash the power of gradients by going bold on the organizational leaders and middle management and then sticking to a gradient outline for other staff.
6. Blueprint-inspired organizational chart

Think outside of the (blueprint) box when designing your organizational chart. Image via Shutterstock.
Not all organizational charts need to be a series of squares, icons, or circles. Step out of the box and incorporate dimension with a blueprint-style approach.
Who knows, something as simple as combining a series of outline shapes to incorporate dimension can be all it takes to add more wow factor to your organizational chart.
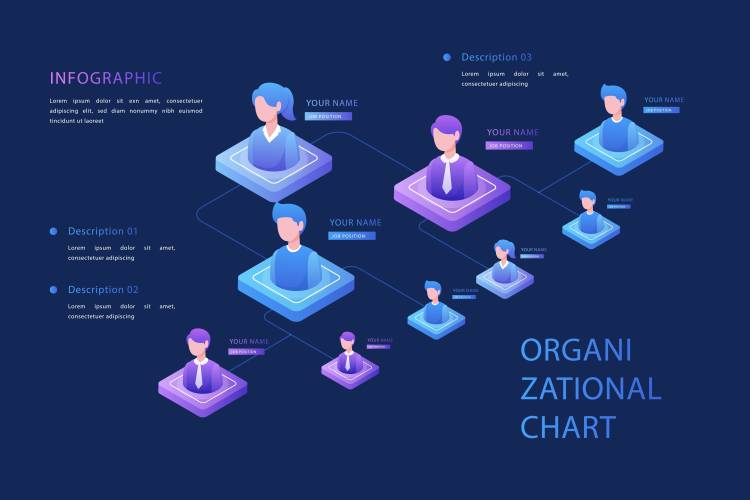
7. Isometric gradient organizational chart

Experiment with various design styles when visualizing your organization. Image via Shutterstock.
Isometric styles, or illustrations that appear three-dimensional, have been a huge graphic design trend. Rather than resorting to the flat, forward-facing style illustrations to represent each level in the organization, try using isometric styles to spruce up your chart.
8. Custom illustration organization page

Image via One Page Love.
If you work within a smaller organization, there may not be as many hierarchies or departments. This gives you the extra creative freedom to go the illustration route and make custom drawings of each team member, with space to add in their job title.
9. Creative shapes organization page

If you’re a Pro PicMonkey subscriber, use our Background Remover Tool to put team members in the spotlight. Image via One Page Love.
Rather than defaulting to a hierarchical, pyramid-style organizational chart, many creative or smaller organizations have a dedicated team page. Having a page to display team members and job titles enables site viewers to learn more about the organization and understand who reports to whom.
Get funky with showcasing team members by overlaying bright and bold shapes to amp up any headshot.
10. Council organizational chart

Like this template? Make it your own in PicMonkey!
For larger organizations that require multiple levels of hierarchy, have no fear! You can easily visualize the structure of your company by utilizing a vertical approach. Focus leaders and executives towards the top and work your way down to the staff with a clear line of reporting for each department.
11. Dark outlined organizational chart

Like this template? Make it your own in PicMonkey!
Go over to the dark side with an inverse approach to traditional organizational charts. While sticking to a white or lighter background enables you to go bolder on the chart styles, don’t be afraid to change it up with a darker background and white shapes, arrows, and text (and yes, we realize this is currently about the scientific method...a simple text swap in PicMonkey will flip the script!).
Amplify this dark outlined organizational chart further by moving each shape and line around to fit the needs of your organization and experiment with various arrow and line graphics.
12. Simplistic circle organizational chart

Like this template? Make it your own in Picmonkey!
If you haven’t caught on yet, less is more in organizational charts. Take it to the basics of design and stick to a cohesive or brand color palette and utilize consistent shapes across each level of management.
The beauty of starting with a PicMonkey template is that you can tweak the overall chart by adding in your favorite modern fonts (or stick to a brand-approved font!), color palette, shapes, graphics, and more! A little change here and there can make a tremendous impact on your organizational chart.
Now that you’re armed to the teeth with these organizational chart examples, it’s now time to get creative! Start with one of our flowchart templates, or do it yourself from scratch with a blank canvas. Experiment with different ways to display each hierarchy, using different shapes and colors to instantly visualize those levels of your organization. You’ll be on your way to a stunning organizational chart in no time!
Need other resources for your business? Rock out on your next social campaign, create stunning business proposals & infographics, and share your business’s success with others via inspiring case studies.
